Mobility Metrics Example
How to join street data to scooter trip volumes
By Emily Eros in How-to · May 8, 2019
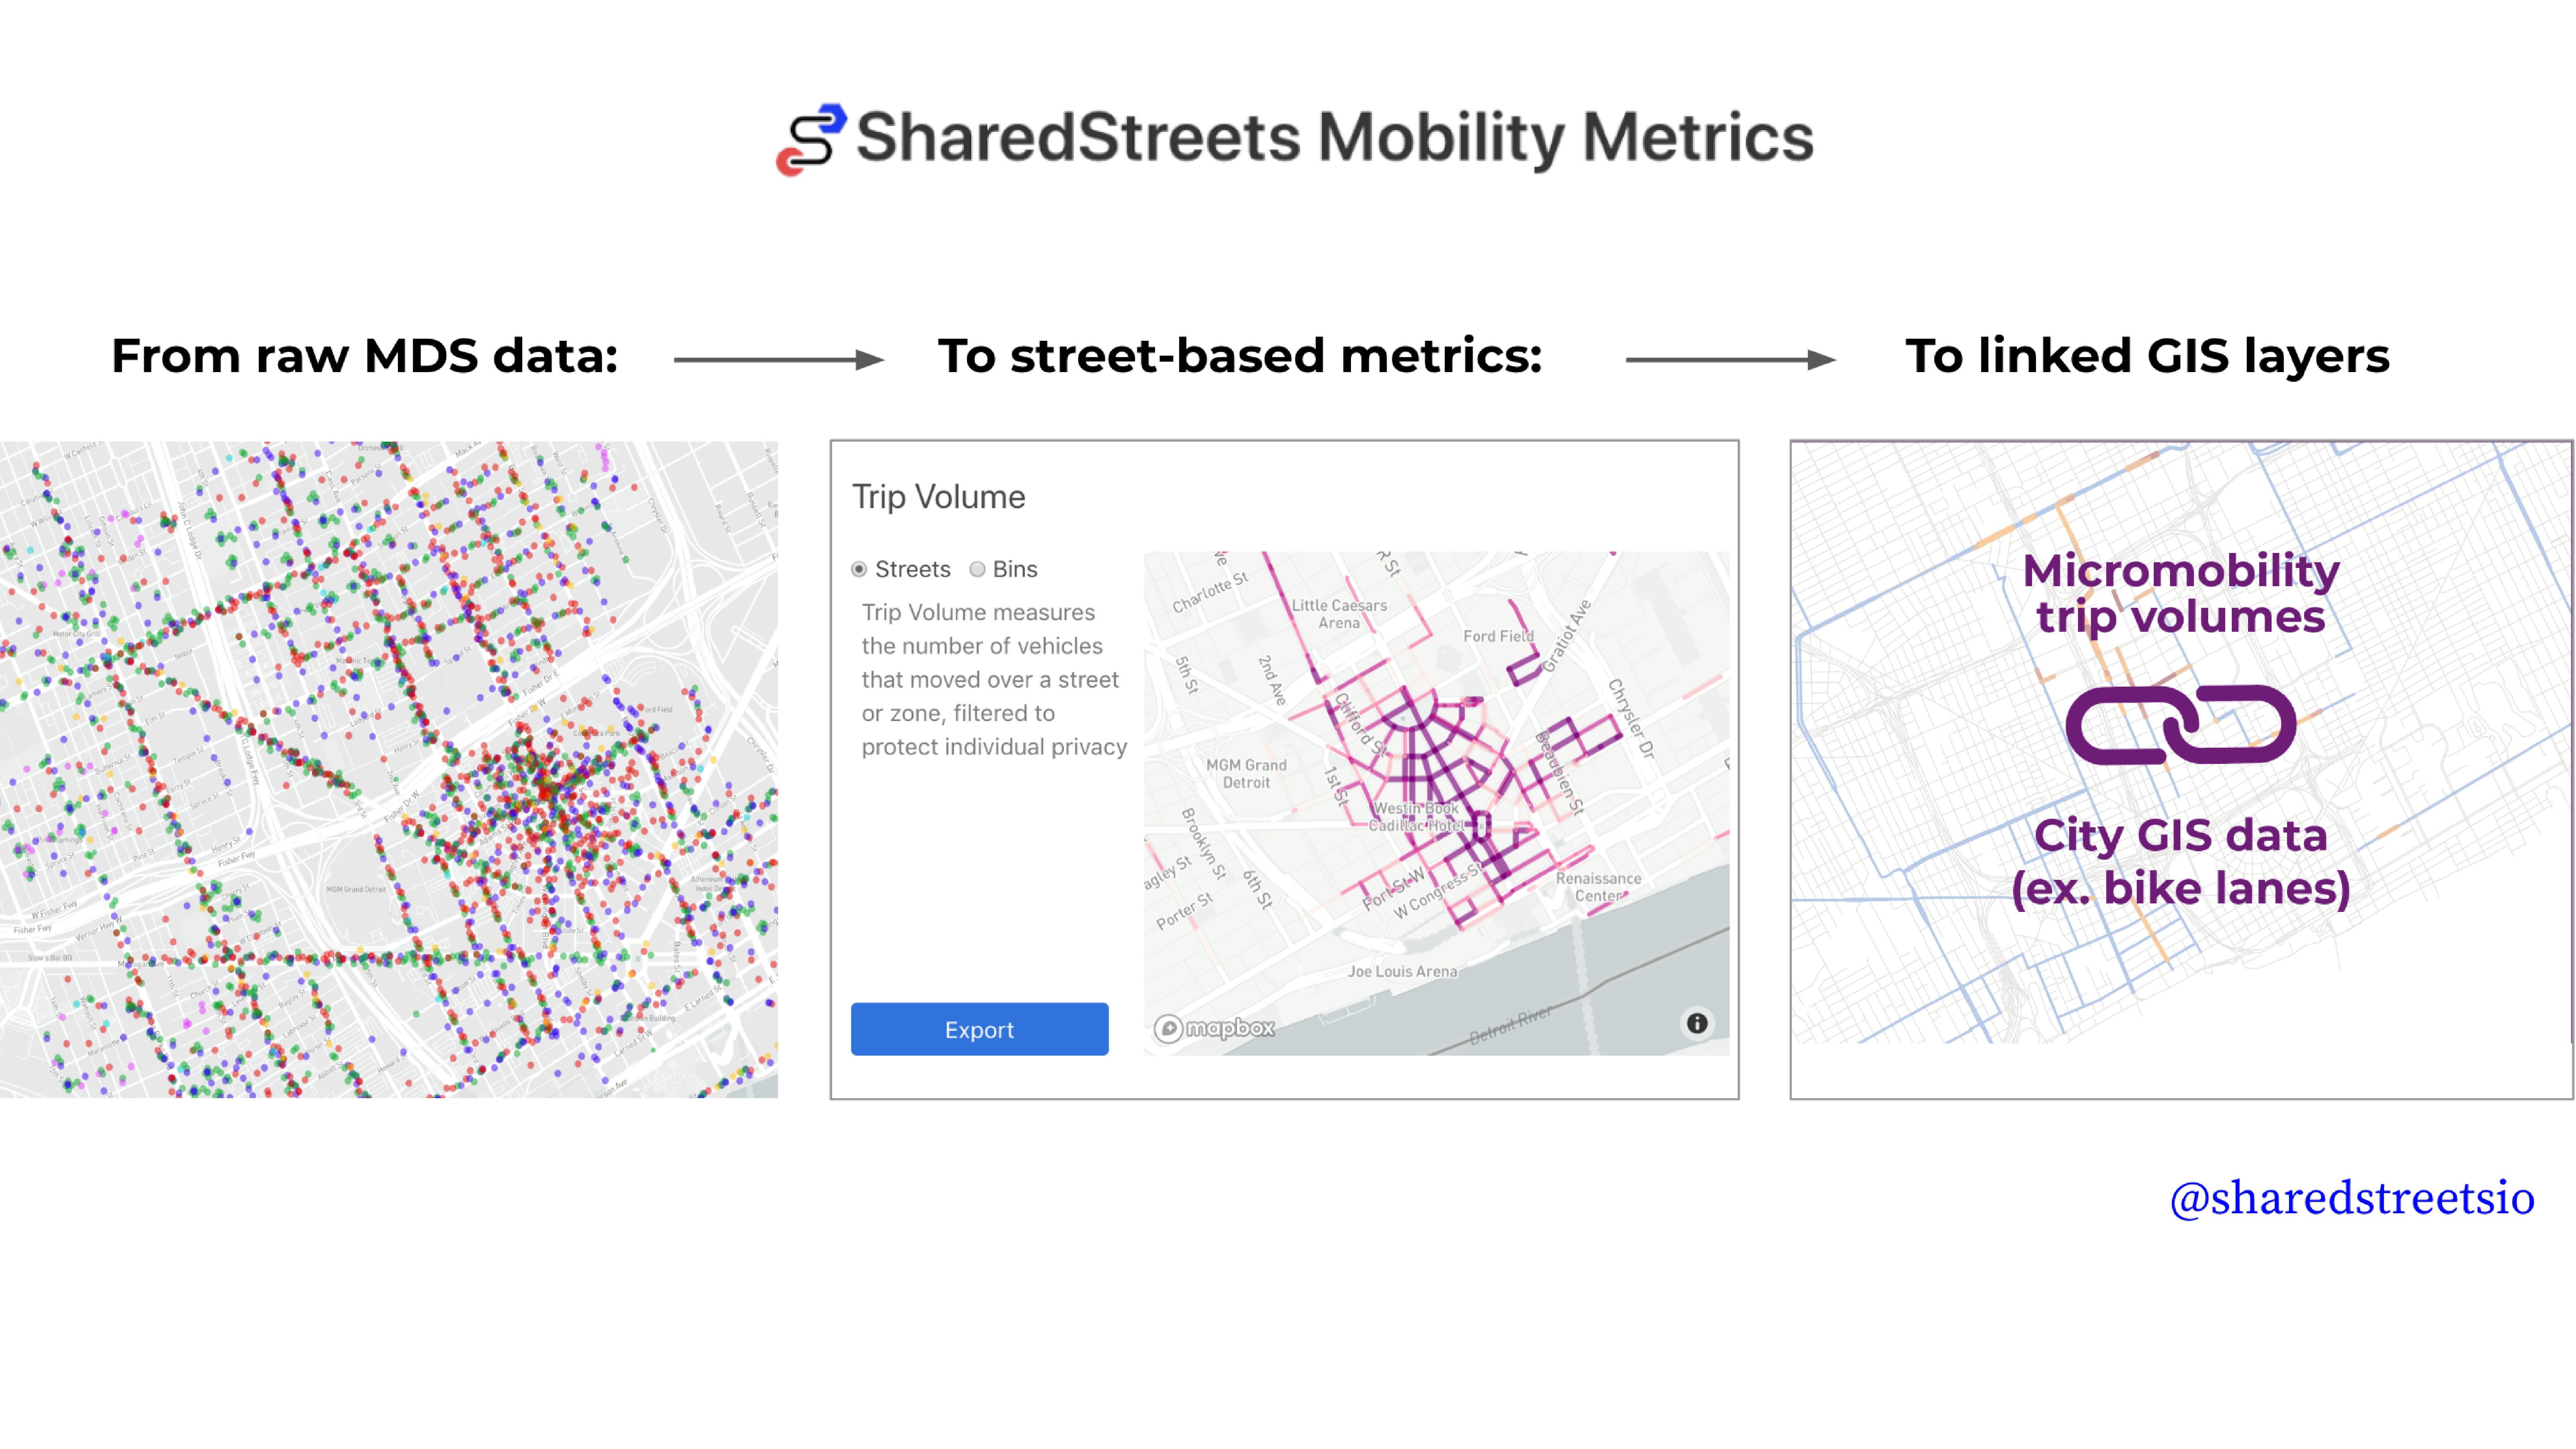
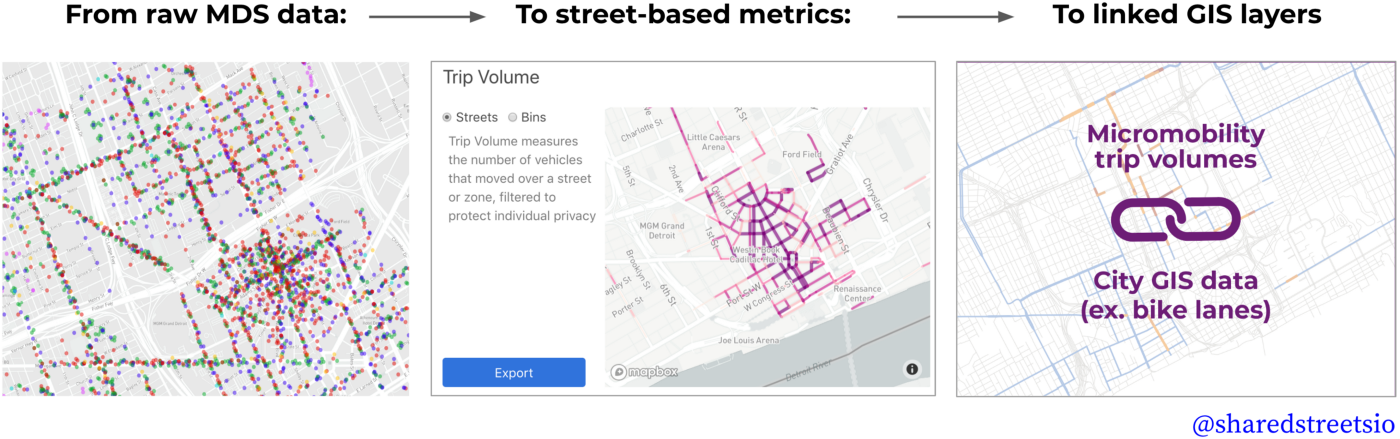
The SharedStreets Mobility Metrics tool aggregates spatial data about micromobility to both the streets where activity occurs and into zones. The tool makes it simple for cities to convert data about scooters and bikes in MDS into useable metrics and bring that information back into a city’s GIS or database system, where endless customization and analysis can easily take place.
This post demonstrates how to use the Mobility Metrics and SharedStreets referencing system to export street-level metrics data into GIS and link it to other city GIS datasets like street centerlines or bikeways. Specifically, it shows how to take scooter trip volumes and link them to bike lanes. This enables a city to analyze whether scooter users tend to ride more on streets or paths with dedicated bike infrastructure, perhaps demonstrating use and benefits of building safe infrastructure.
 If you don’t have the Mobility Metrics web interface running, you will find instructions here.
Step 1. Generate the mobility metric
First, run the Mobility Metrics web interface and select the time period you are interested in. This example uses the day of November 10, 2018. Navigate to the Trip Volume metric and ensure that the map is showing street-level data (not the hexagonal zones). Hit “Export”. The data will download as a JSON file.

Step 2. Load the output into GIS
Next, we add the JSON into a desktop GIS application, like ArcGIS or QGIS. In QGIS, you can simply drag-and-drop the JSON into your map. In ArcGIS, you may need to convert it to a feature class first (you can do this using Geoprocessing → Conversion Tools → JSON → JSON to Feature Class).
In GIS, the data looks like this:
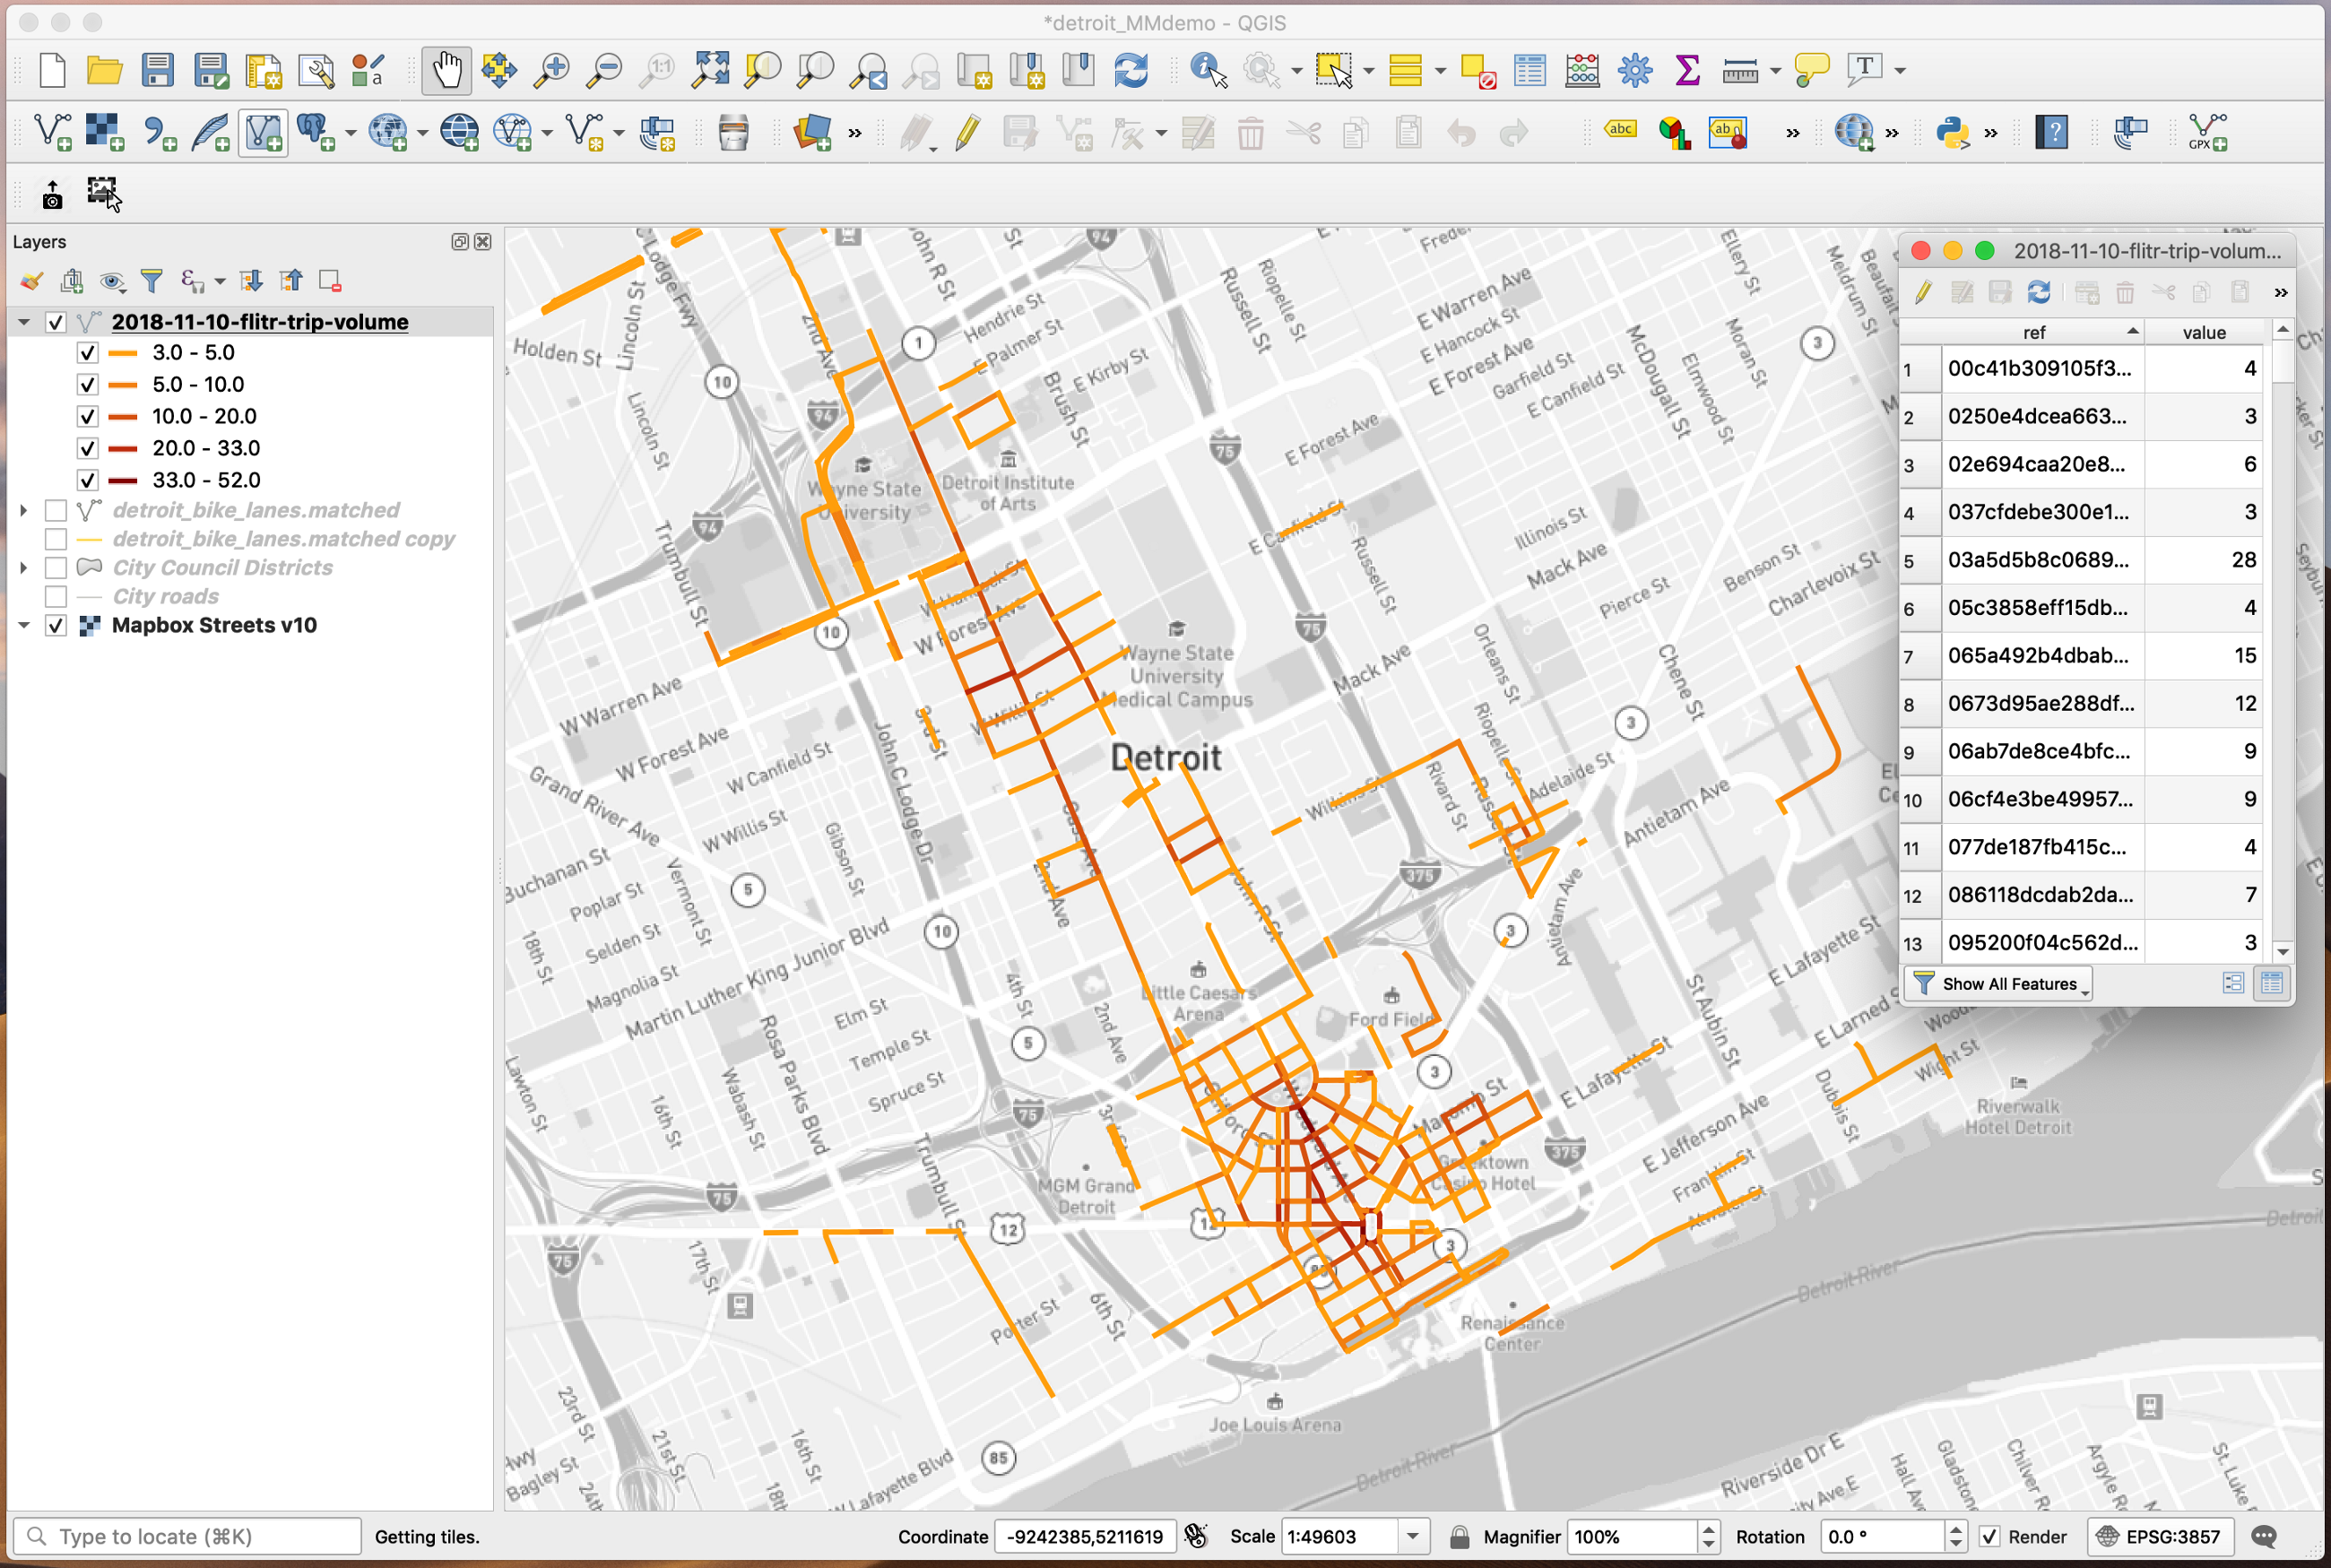
For street-level output, the attribute table contains the relevant metric (in this case, the daily scooter trip volume for each street segment). It also includes a SharedStreets reference for the street segment. This is shown in the image above. We will use this reference to link the mobility metrics to other street datasets.
Step 3. Set up the SharedStreets map-matching tool
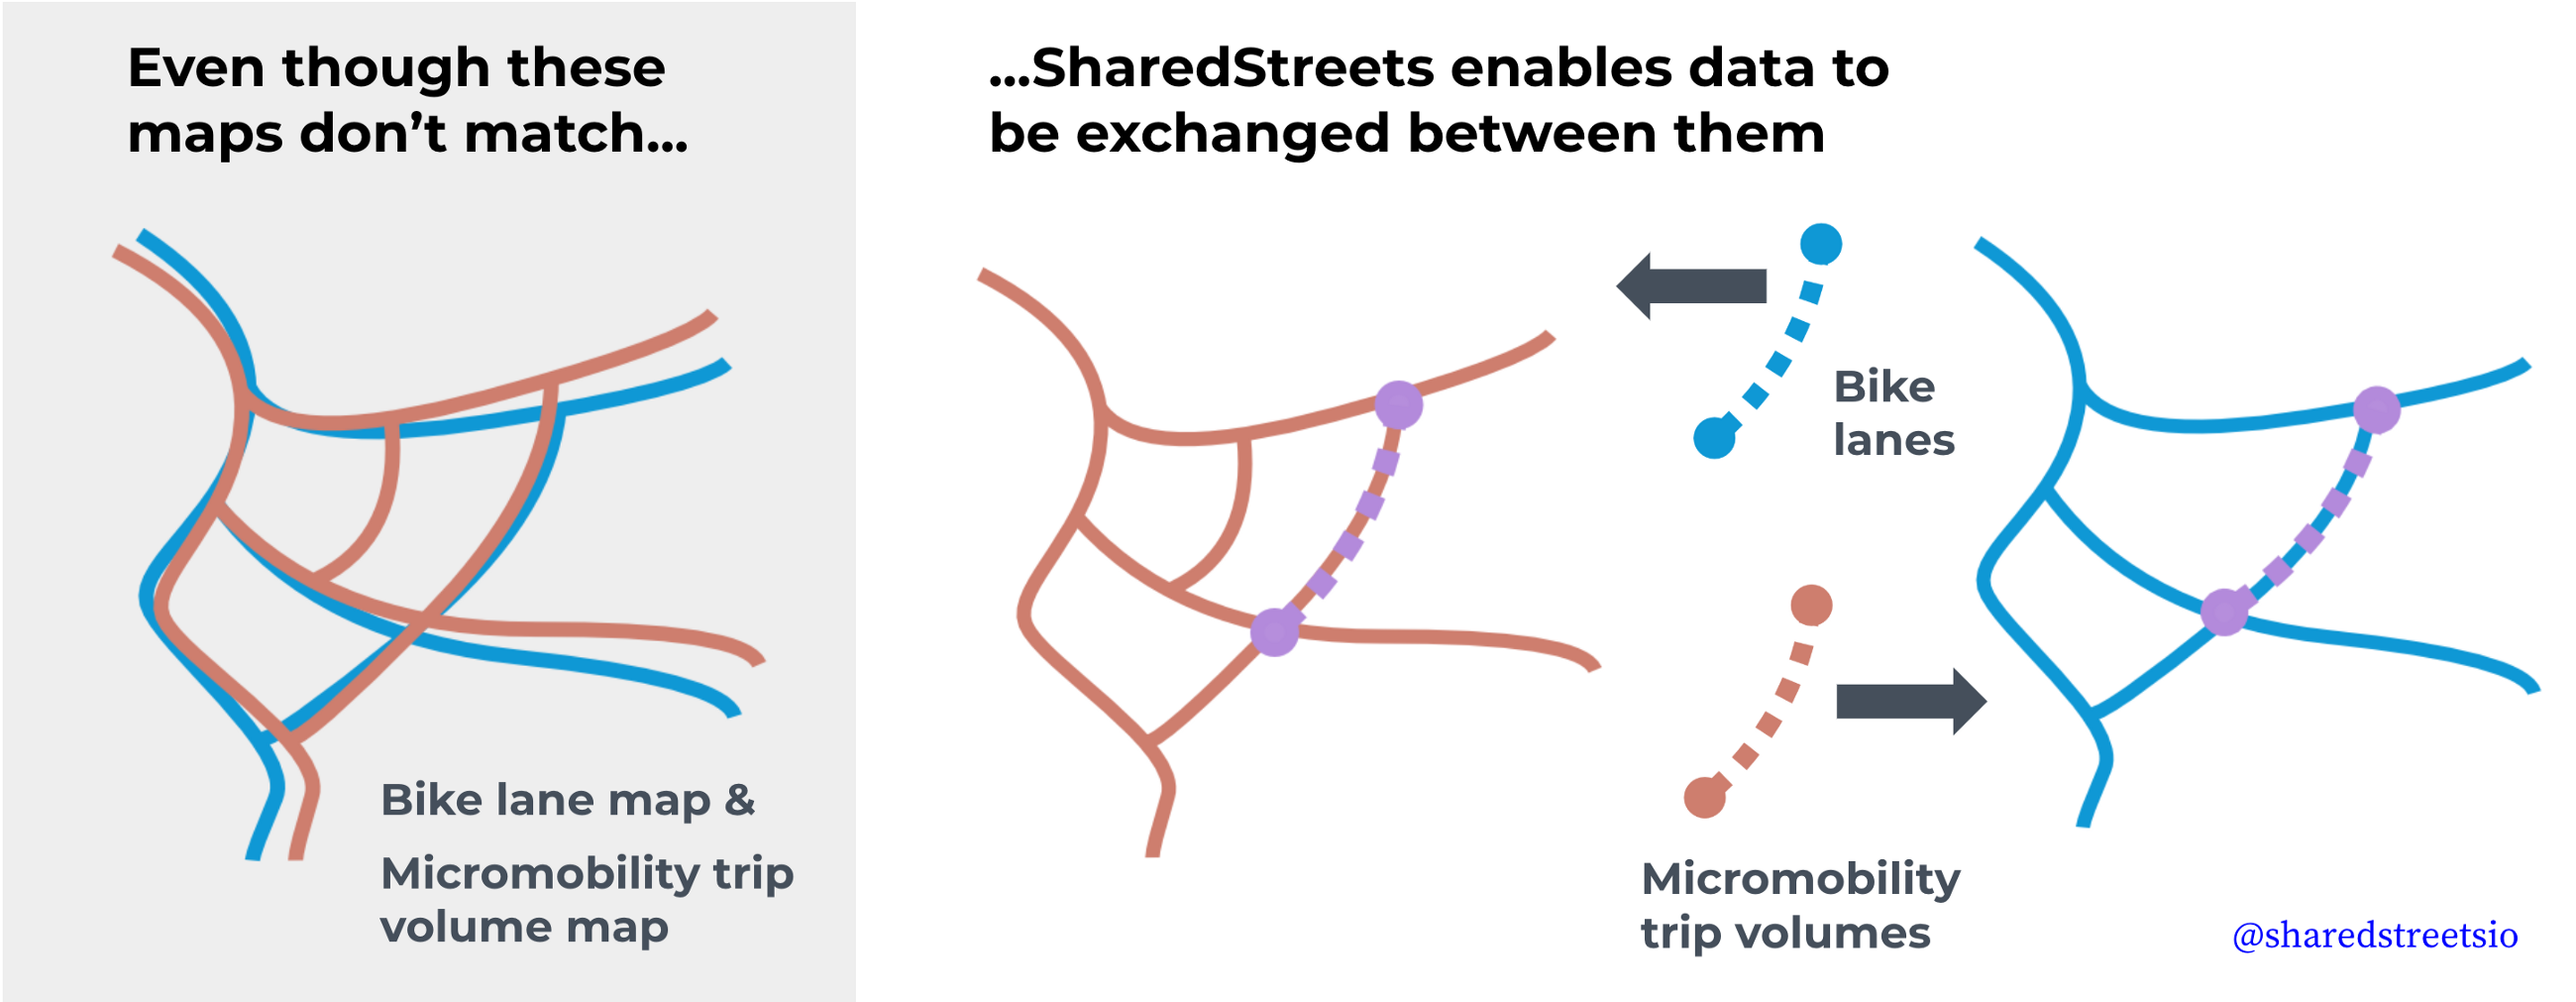
The SharedStreets referencing system creates a common identifier for street segments that may have slightly different geometries in different maps. Even though the street segments from the Mobility Metrics tool will not exactly match a given city’s internal street map, the referencing system allows us to port attributes, like scooter trip volumes, over to city GIS layers, like so:
SharedStreets has developed a command line interface (CLI) that can be used to match GIS data to the SharedStreets referencing system. Use the instructions on Github to download the open source code, set up the matching tool, and test it. If you need further instructions or examples of how to do this, see our blog for other examples.
Step 4. Prep the GIS input dataset for matching
Locate the GIS data that you want to link to the mobility metric. This should be a street-based dataset, like centerlines or bicycle greenways. In this example, we are using city bike lanes.
Export or convert this data to a GeoJSON file, in the WGS 84 coordinate reference system (EPSG: 4326).
Step 5. Match the bike lane data to the SharedStreets referencing system
Use the CLI to match the data layer to SharedStreets. To do this, open a new shell window. The following single command will perform basic matching:
$ shst match your-data-path/input_bikelanes.geojson
--out=output_bikelanes.geojson
This command uses standard matching parameters and is appropriate datasets that pertain to motor vehicles. However, off-street bike paths are a special case. To handle those, we add two additional parameters to the matching command, as shown below:
$ shst match your-data-path/input_bikelanes.geojson
--out=output_bikelanes.geojson --match-bike --tile-hierarchy=8
The match-bike flag excludes highways and makes sure that the routing engine used for the matching (OSRM) uses bike routing options. The tile-hierarchy=8 parameter ensures that the geometries to match against include OpenStreetMap features that are not useable for motor vehicles but may be useable for cyclists, such as cycleways, paths, and tracks. (More information on tile hierarchies is available on Github). This extra parameter ensures that off-street bike and multimodal facilities will be able to match to SharedStreets.
Substitute your filenames (and add the pathway to the input data directory, if necessary) and run the command above, with the extra bike options. You will see a progress bar and and an indication of how many features matched:
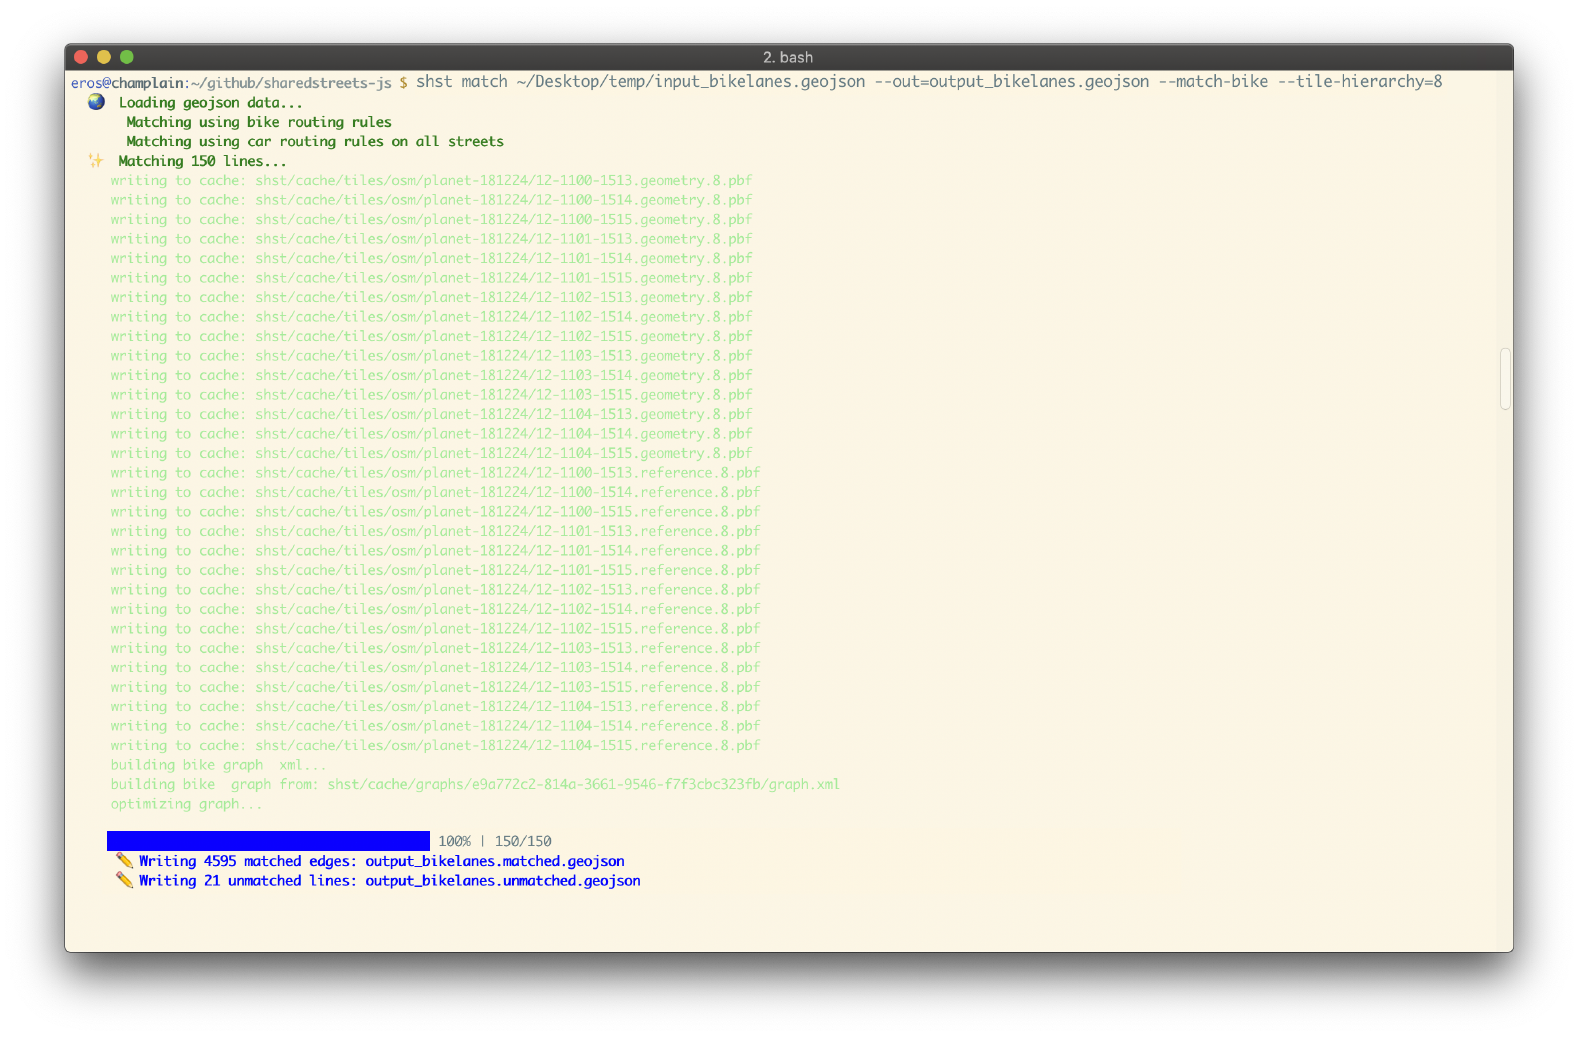
The matching generally produces two files: an output file containing features that matched successfully, and an output file containing features that did not match. If the input data were not appropriate, then there will be a third output file containing features that were invalid and therefore excluded from matching.
The output files will be saved in the current directory. Navigate to this directory and find the matched output. In this case, this is output_bikelanes.matched.geojson. Load this data into your GIS project. It should look something like this:
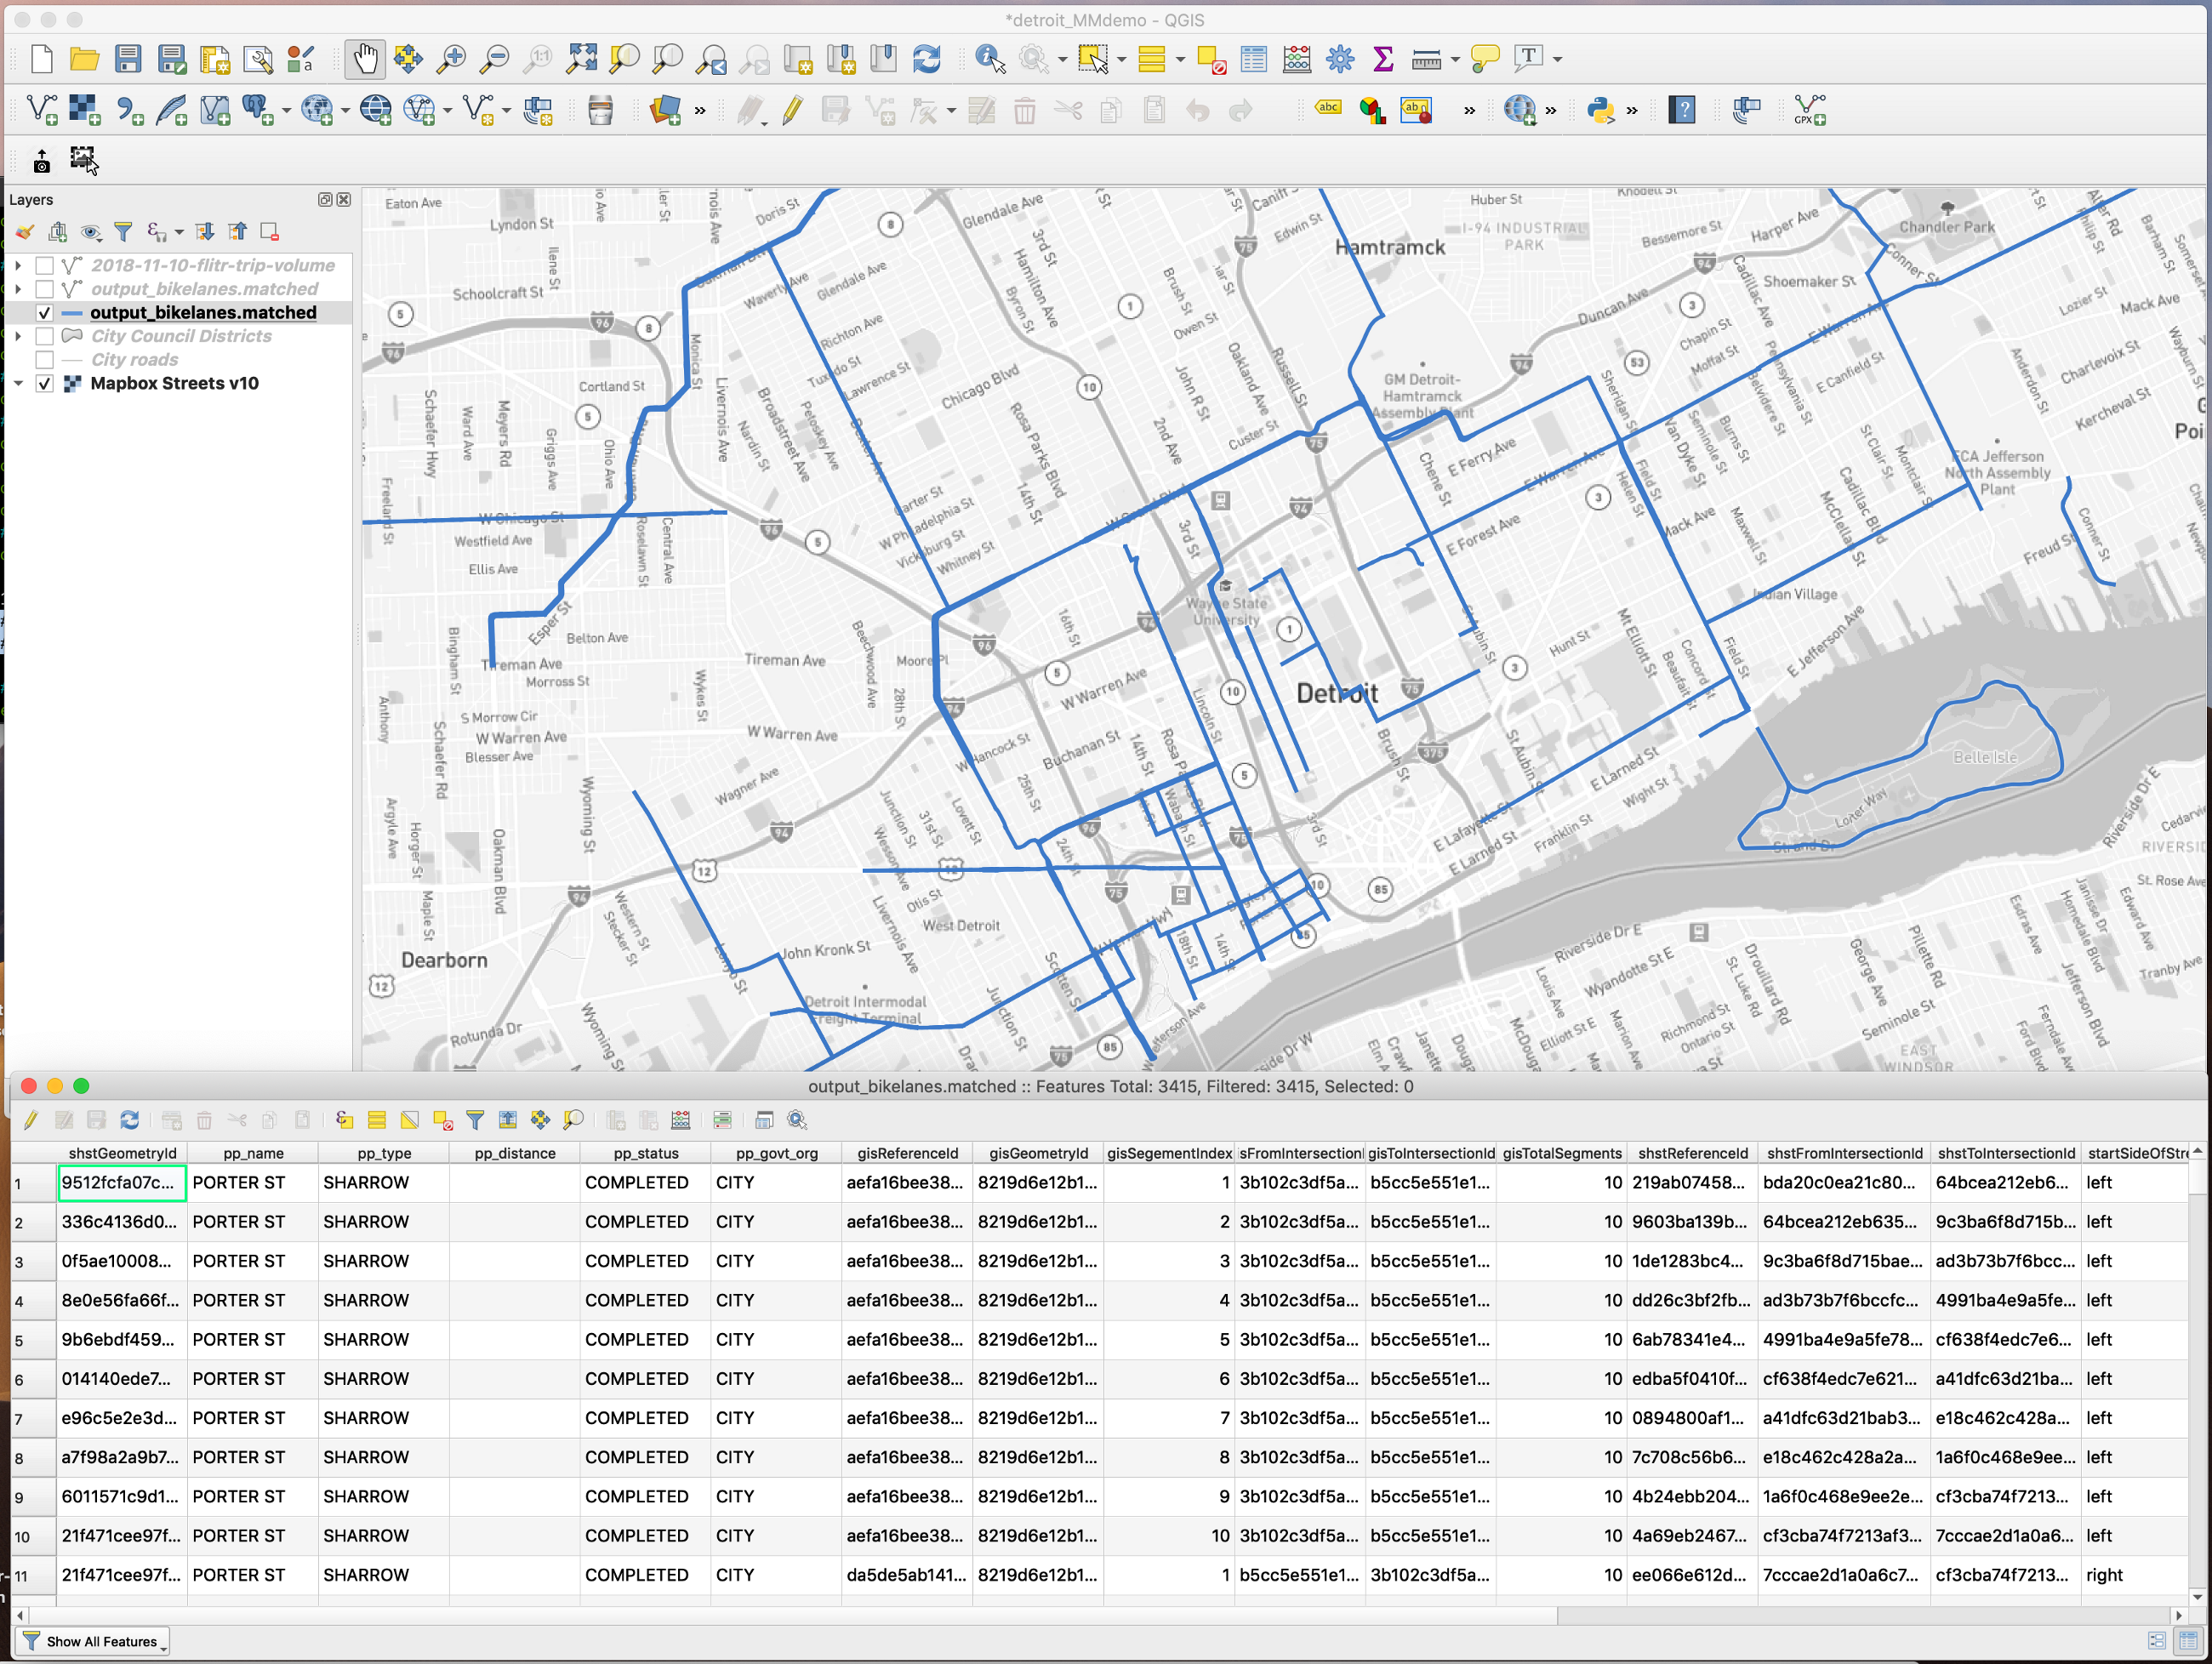
In the attribute table, you’ll see the original data properties, as well as new SharedStreets properties like the shstReference ID, the shstGeometry ID, the shstFromIntersectionID, and the shstToIntersectionID. (You’ll also see similar properties for the gisReferenceID, gisGeometryID, etc. The fields with the gis prefix corresponds to linear referencing that has also taken place for the geometries of the GIS data input.)
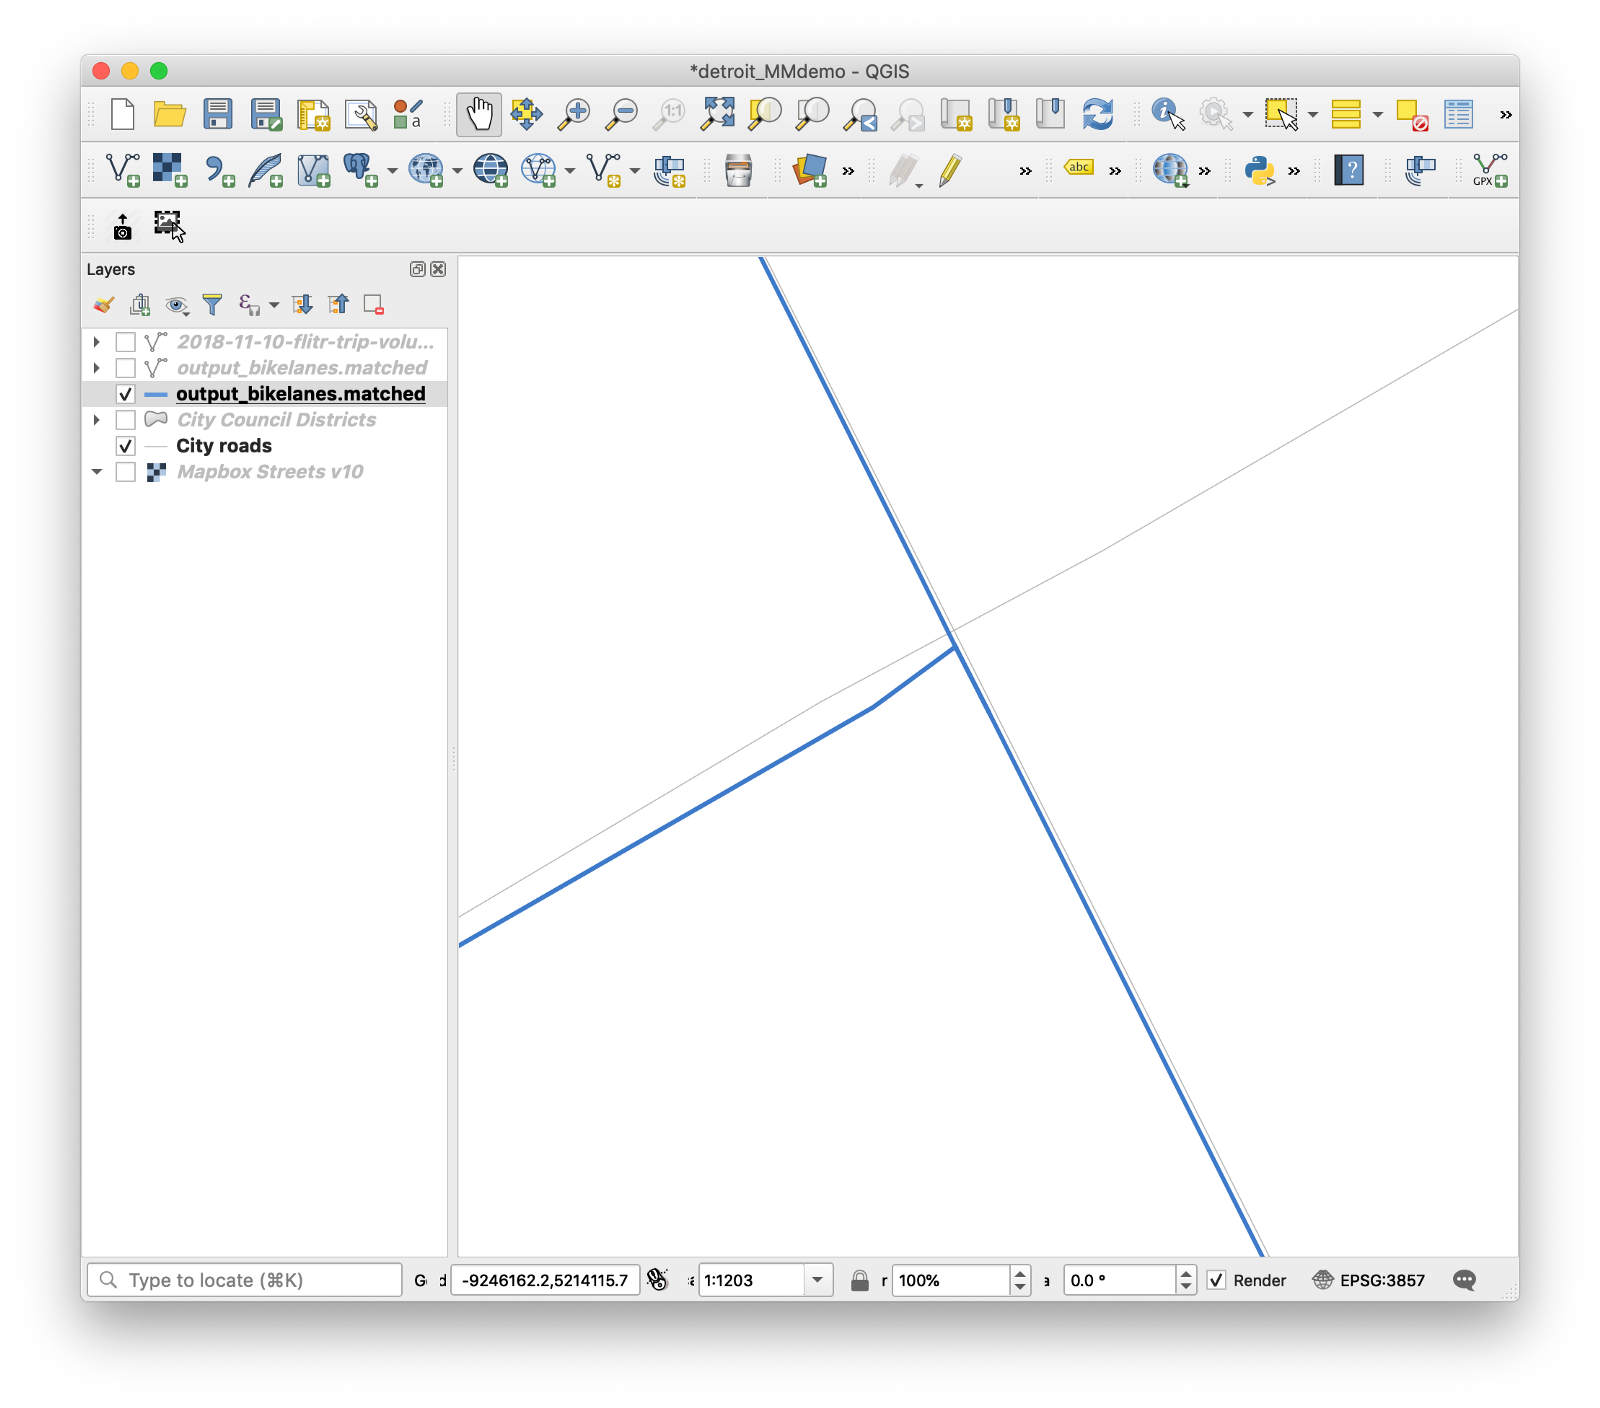
If you look closely, you may notice that the matched data has a slightly different geometry than the input data. This is because SharedStreets geometries are based off of OpenStreetMap and generally will not align perfectly with city or country GIS data. Instead, SharedStreets enables us to port properties between street datasets, regardless of whether their geometries perfectly match. For mobility metrics data, we will use the ShstGeometryID field to create a link between the matched GIS bike lanes and the exported mobility metric.
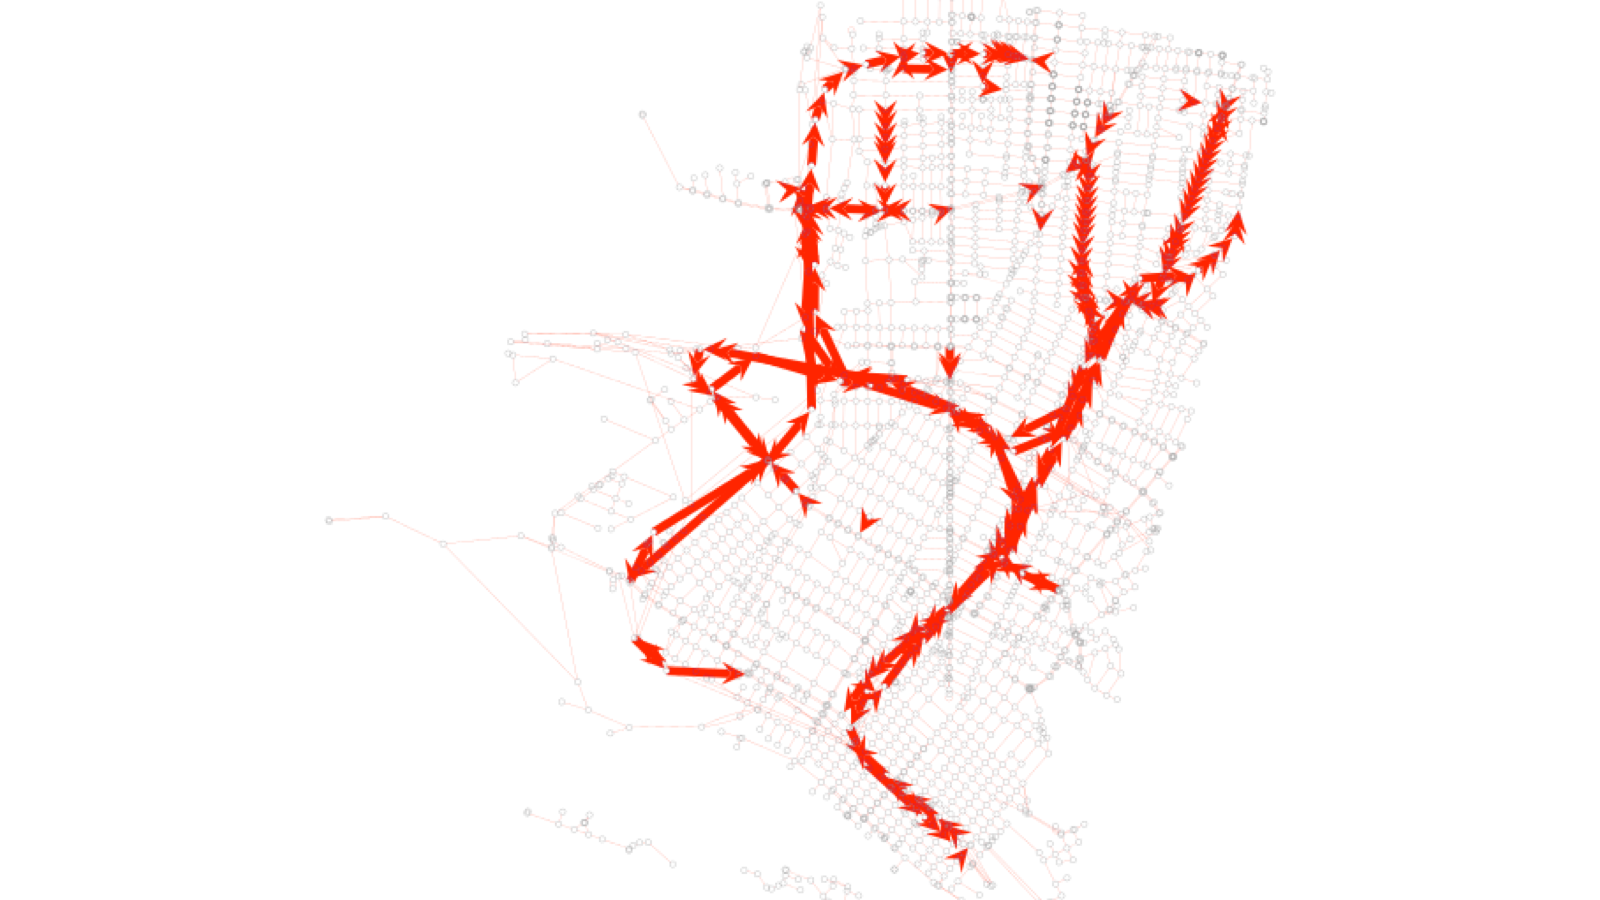
Step 6. Join the matched bike lanes to the scooter trip volumes
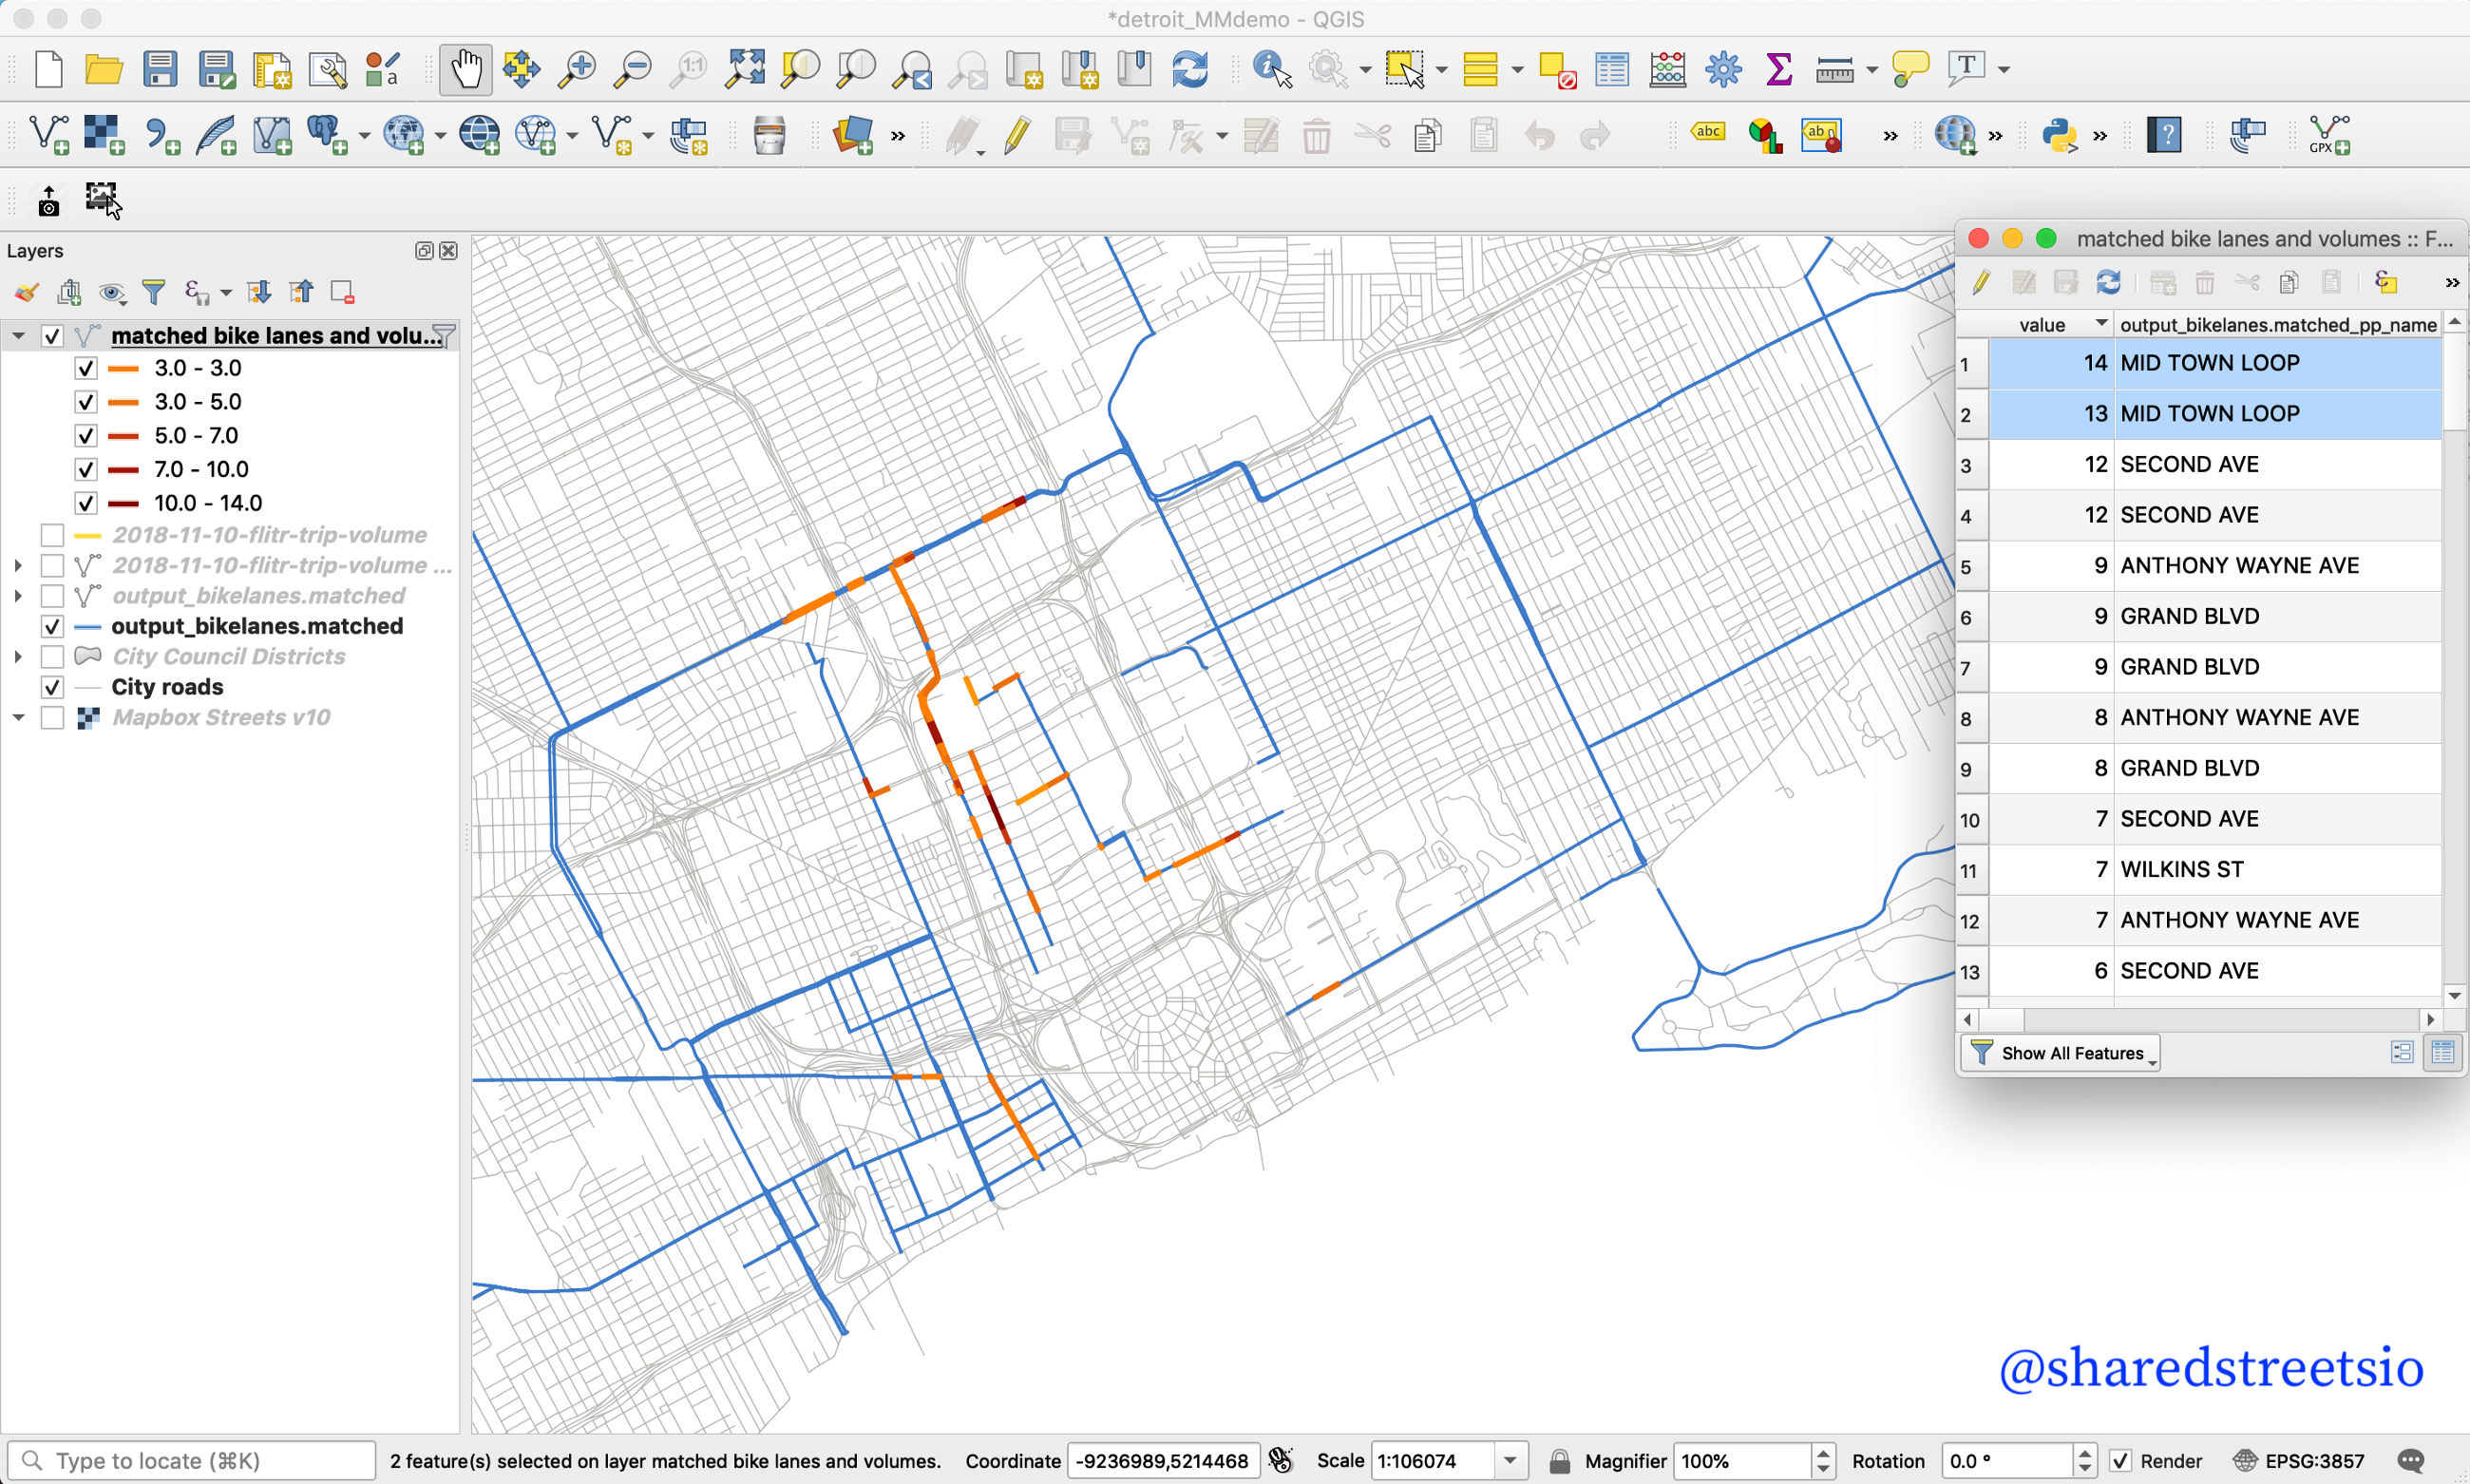
In GIS, perform a join between the scooter trip volume layer and the matched bike lane layer. Using ref and ShstGeometryId as the joining fields. This allows us to visualize bike lanes by trip volume, for example. In the image below, streets with bike lanes that experienced scooter trips are shaded orange-to-red, according to the number of trips. Other streets with bike lanes are shaded blue. In the attribute table, we see that the Midtown Loop was the most popular bike lane for scooter trips:
Summary
This example shows how city GIS data can be linked to dockless mobility data. This is traditionally a difficult problem to overcome. Third-party datasets (and even a city’s own GIS datasets) are often difficult to combine because base maps do not match perfectly. This makes it difficult and cumbersome to port information between different maps. However, the SharedStreets referencing system creates a common way to refer to streets, making it much easier to perform analysis and answer questions about what’s happening in a city — for micromobility or for other transportation questions.
For more examples of how SharedStreets can support a city’s workflows, see our other blog posts. If you have questions or run into difficulties, reach out and we’ll try to help!


Get Involved
Do you work for a city or government agency? A private company? Or are you an independent researcher or developer? Learn how to start using the SharedStreets Toolkit.
Get Started