Introducing SharedStreets Mobility Metrics!
By Mollie Pelon McArdle in Pilot Perspective · May 6, 2019
Cities need mobility data to manage their streets. The influx of scooters and dockless bikes in American cities has resulted in large amounts of data flowing from companies to cities. This data has cities asking new kinds of questions and we need transparent tools to empower that inquiry.
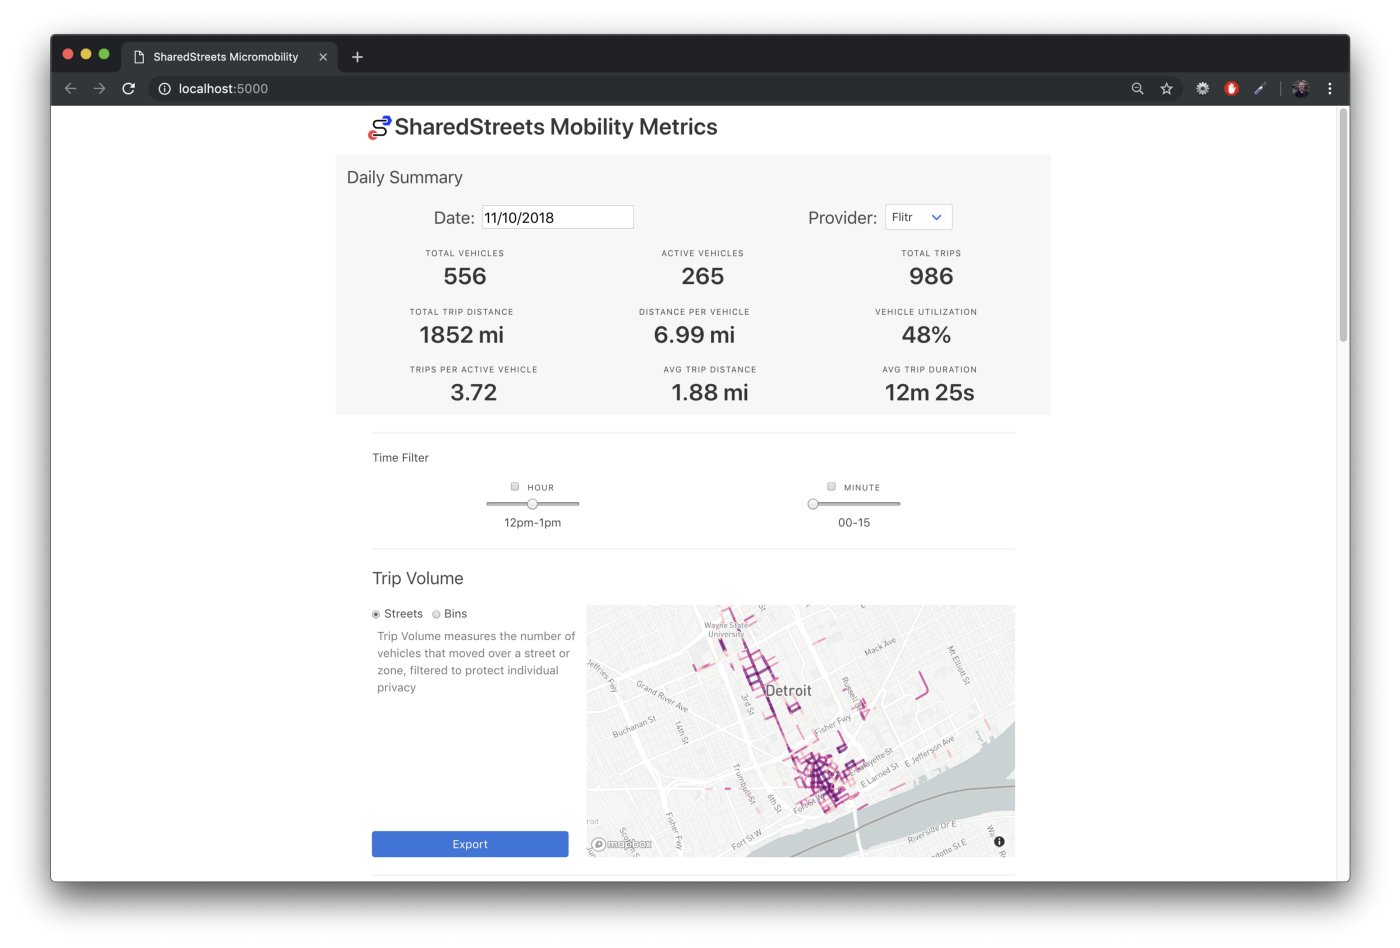
SharedStreets Mobility Metrics is open source software that turns the large datasets many cities receive about scooters into a set of open metrics that answer common questions like, ‘how many scooters were available in my city at 8am?’, ‘how long is the average scooter trip’ and many more!
Data that works for you on your terms.
We don’t get in between cities and their data. Mobility Metrics is a locally-hosted application that runs entirely on city infrastructure.
In keeping with SharedStreets’ values, it is open source, fully customizable, and helps limit privacy risks by working with data in aggregate. Data is linked and aggregated to the street using the SharedStreets Referencing system, making it interoperable with other street-linked data sets and easy to export to your preferred workflow.

Data for dockless mobility devices (e.g. bikes and scooters) is often available in a standardized format called MDS. The raw MDS feeds contain a vast amount of data and has to be extensively translated, processed and analyzed to answer common questions cities are asking about scooters on their streets. The mobility metrics software takes this raw data and translates it into answers to common questions cities are asking.
We hope the mobility metrics software can contribute to creating a standard, transparent set of metrics that evolve with standards and cities, and create an open process for evaluation.
Metrics, metrics, metrics!
We have been talking to some cities about the metrics they use to evaluate micromobility. This is our first draft. Ideas and contributions for existing and future metrics are welcome and encouraged (submit them here & label them ‘metrics’). We will be regularly checking feedback and updating metrics.
Currently, the Mobility Metrics tool generates a set of overall metrics that focus on daily activity for dockless vehicles across the city, as well as a set of map-based metrics that produce geographic data and can answer more detailed questions about particular streets, zones, neighborhoods and time periods when a minimum trip threshold is met.

Overall Metrics
Available as daily summaries:
- Total vehicles: Total number of vehicles that were on the street at any time during the specified day. This includes all vehicles that were available, unavailable or reserved according to the event types specified here.
- Active vehicles: Total number of vehicles that completed at least one trip during the specified day
- Total trips: Total number of trips taken throughout the specified day
- Total trips distance: Total miles traveled by any vehicles throughout the specified day
- Vehicle Utilization: Percentage of vehicles that were active over the course of a day
- Average distance per vehicle: Total trips distance, divided by active vehicles
- Average trips per active vehicle: Total trips, divided by active vehicles
- Average trip distance: Total trips distance, divided by total trips
- Average trip duration: total trips duration, divided by total trips
Map-based Metrics
Available for specific time intervals:
- Trip Volume: The number of vehicles that moved over a street or in a zone during the time window specified.
- Availability: The maximum number of vehicles that were available to users during the time window specified.
- On-street: The maximum number of vehicles that are on the street and available or unavailable during the time window specified.
- Pickups: The total number of trips that began during a time window
- Dropoffs: The total number of trips that ended during a time window
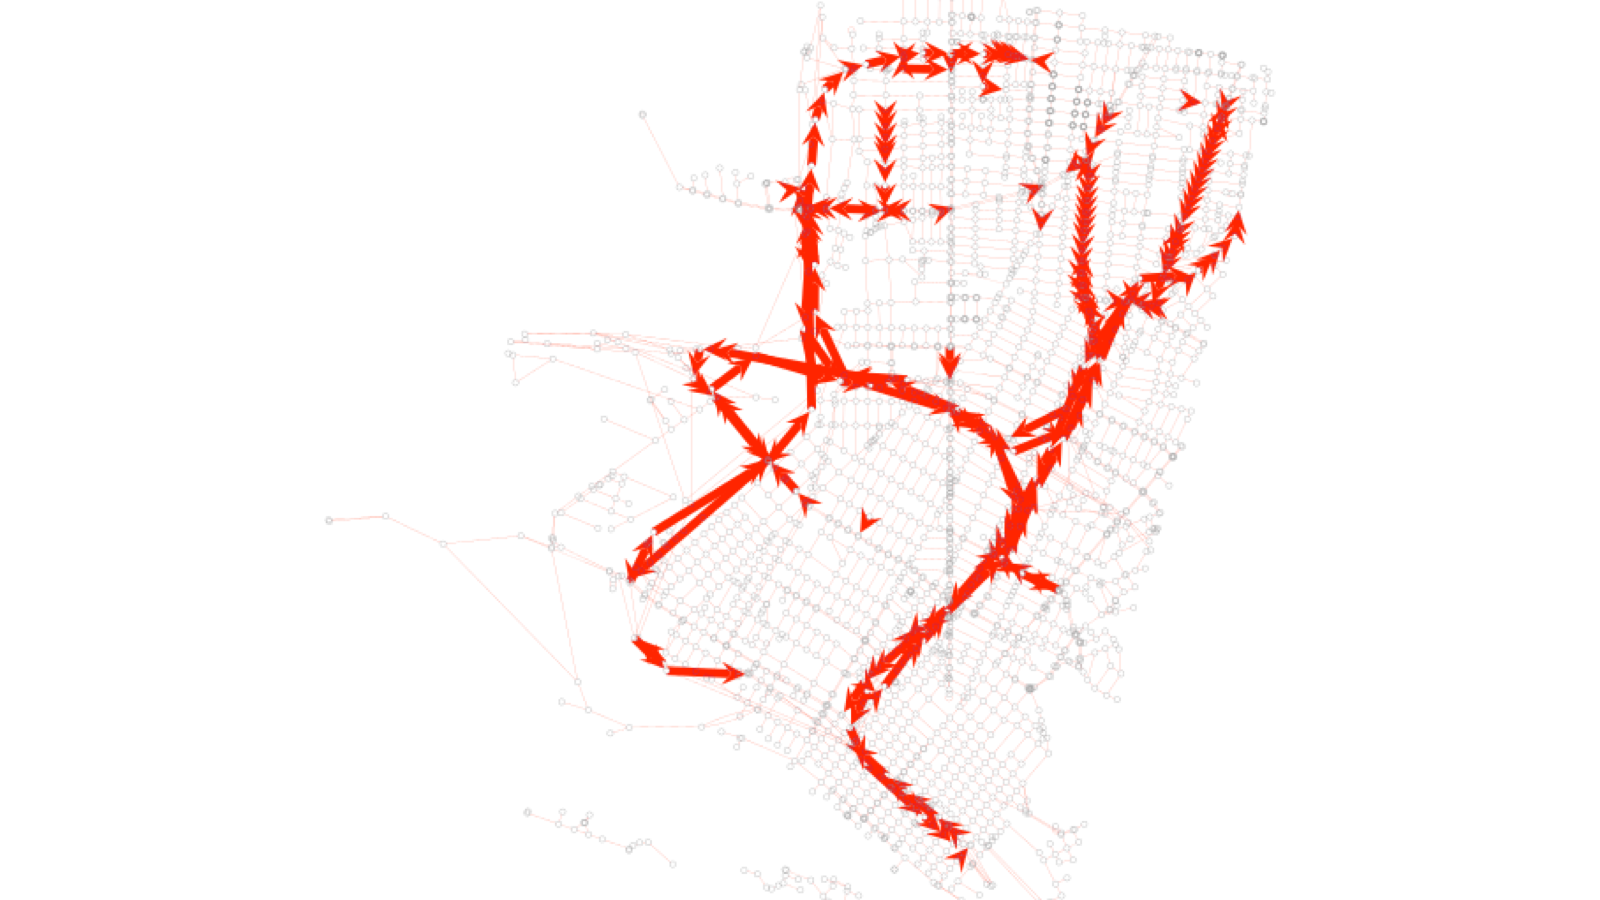
- Flows (O/D pairs): The number of trips that went from one area of the city to another area of the city, sometimes referred to as origin/destination data or “O/D pairs”
All changes to metrics will be reflected in the Github readme linked here.
Aggregation
Mobility Metrics currently aggregates information based on time of day or geographic areas, provided the minimum trip threshold is met. The aggregation of individual trips or points to a minimum trip threshold in a given area ensures that data is not unnecessarily stripped of information when the density meets or exceeds the minimum threshold.
Time of day aggregation: Specific time aggregations can be specified, for units ranging from a day to a 15-minute window
Geographic areas: Two options for geographic aggregation are currently available. Different options and combinations are available depending on the metric.

Street segment-based aggregation: Data about transportation is usually most useful when it is linked to the street. We use the SharedStreets referencing system to link point data and line data to street segments. Aggregating to street segments using SharedStreets references results in data that is portable can be re-linked to other street related datasets, like parking. Aggregation to the street also allows you to keep the fidelity of data, where the minimum threshold is met, to see things like how many vehicles are traveling on specific street segments.
Area-based aggregation: Right now, this returns metrics that have been aggregated to hexagonal shapes, using a standard format called H3. This allows users to easily see patterns across the city, and enables GIS users to re-aggregate the data into larger areas like neighborhoods and zones. The default “zoom” level for the H3 bins is level 9, but the city can customize this and set it to the granularity they prefer.
Privacy
SharedStreets regards individual trip data as highly sensitive information that should be protected in order to safeguard riders’ privacy. Mobility Metrics uses the aggregation techniques discussed above and a minimum trip threshold to avoid showing individual trip data. The tool performs all metric calculations in-memory, and raw data is not archived locally.
The software also has a programmed minimum trip threshold. The minimum trip threshold exists to help mitigate privacy risks by aggregating individual trip data. The default threshold is three unique trip pairs. If a zone or street does not have sufficient trip activity in the desired time period in order to meet this threshold, then the data for that area will not be shown.
However, this software is designed as a framework for implementing and understanding data aggregation methods. While the specific thresholds are configurable, we strongly encourage users to work with data in aggregate. We’re building these tools to help explore the tradeoff between aggregation and temporal/spatial resolution. Finer resolution requires that more trips be aggregated. This is important not only for privacy, aggregation is needed to extract useful information from sparse data.
Getting started
All source code is free to use and completely open, with no strings attached. Full documentation is available on Github, and cities can follow these instructions if you are comfortable deploying and securing a production service. If not, get in touch with us! We’re happy to help walk through security and deployment, as well as workflows for integrating the outputs into GIS systems used by planners.
We’d love to hear from you
We are very excited to receive feedback on the Mobility Metrics tool and the metrics it calculates. Submit an issue on Github or reach out if you have questions or comments to share with us!


Get Involved
Do you work for a city or government agency? A private company? Or are you an independent researcher or developer? Learn how to start using the SharedStreets Toolkit.
Get Started