Mobility Metrics v2.0
By Morgan Herlocker in Pilot Perspective · July 23, 2019
SharedStreets has released the next major version of our mobility data aggregation toolset, mobility-metrics. For version 2.0, we have focused on ease of deployment and more detailed metrics to help cities understand fleet sizes.
What’s New?
Understanding fleet patterns
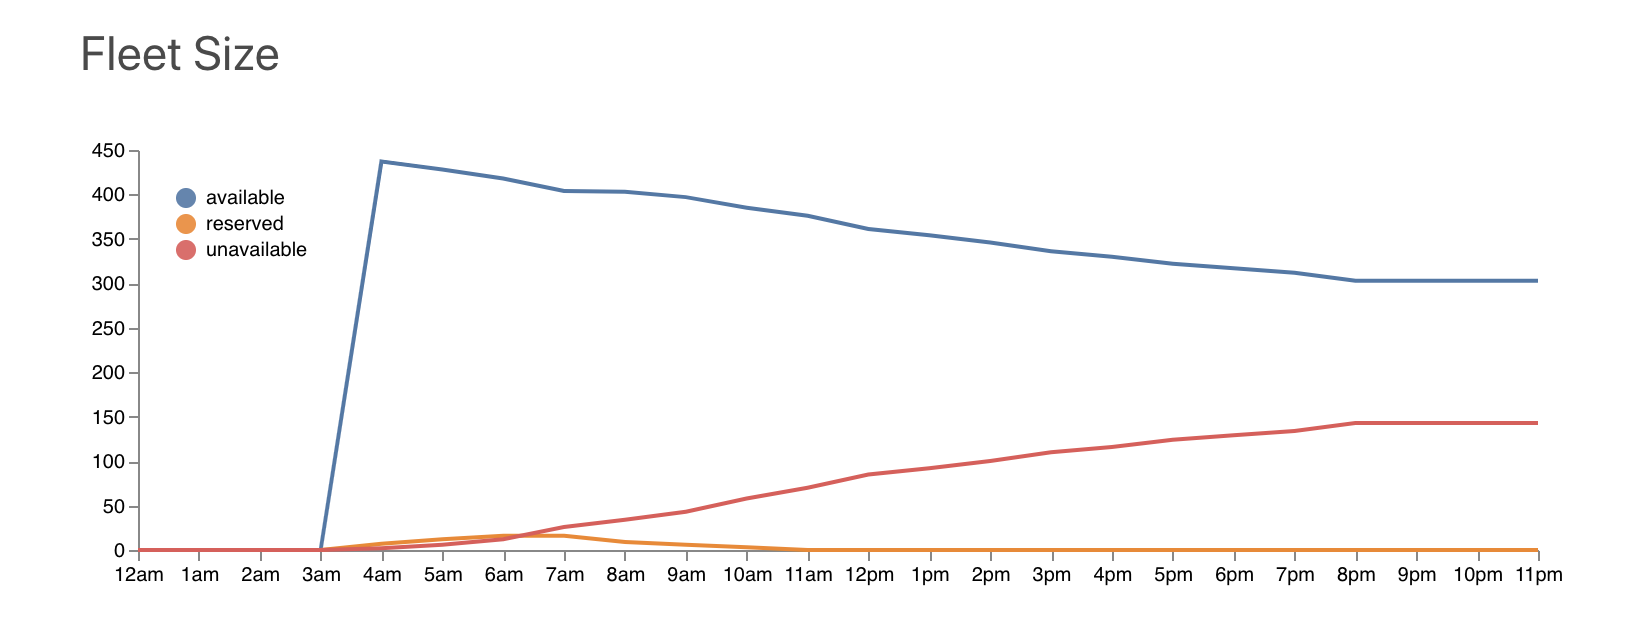
Important new metrics describing fleets were introduced in v2.0. ‘mobility-metrics’ now creates hourly totals of fleets sizes using the reconstructed MDS status_changes feed. Cities with cap enforcement can use these totals to understand how many vehicles are available, reserved, or unavailable on the street at any point in time.
Easier deployment
Mobility metrics is now published as a command line interface. There is now a one step install to get setup once a Linux machine and credentials have been secured.
npm install mobility-metrics -g
This interface can be configured to run on a daily schedule to continually ingest and aggregate vehicle telemetry. While any command line scheduling system can be used, here is an example setup with the popular ‘cron’ tool:
0 0 * * * mobility-metrics \
  --config config.json \
  --public ./public \
  --cache ./cache \
  --day 2019-07-20
Static Hosting
While raw MDS data is sensitive, the metrics and reports produced by mobility-metrics are not. It is now possible to serve reports and metrics data generated by the CLI with any static HTTP server. This creates both a visual interface and a queryable API out of the box. To demonstrate, the public demo is served straight from Github Pages with no server required.
/data
The data endpoint contains daily summaries of metrics data in a convenient JSON format. This data can be used by open data researchers and city officials to understand the impacts of emerging mobility technology. The raw data endpoint can be used to power new analysis and applications.
/reports
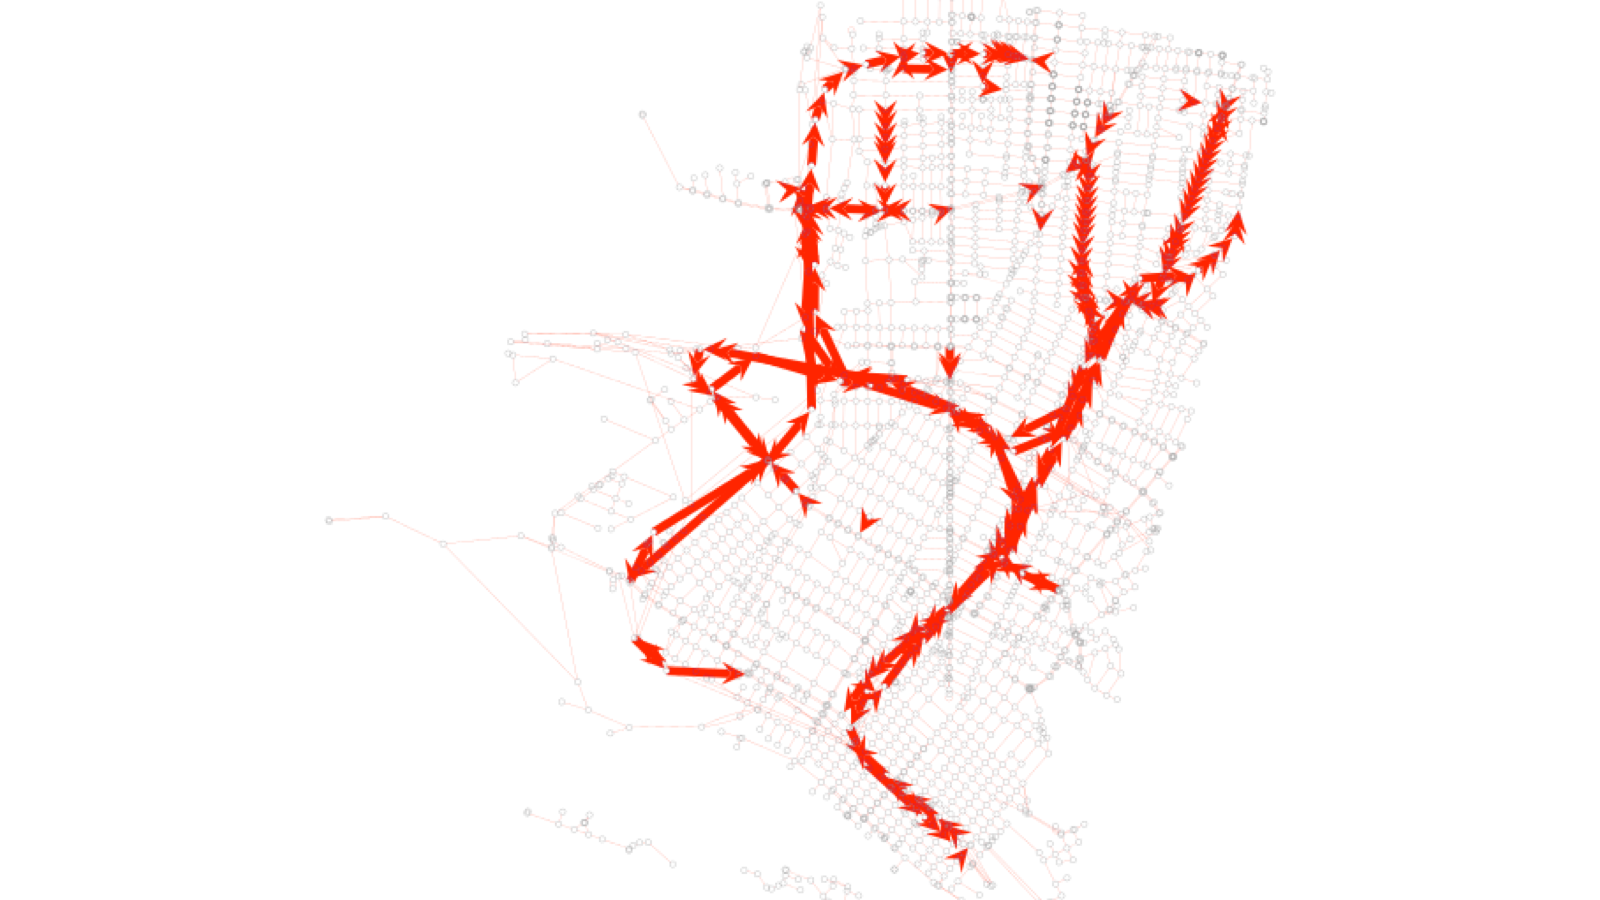
The reports endpoint provides a user interface with daily summaries of metrics, visualized across maps and charts. For GIS analysts, data can be filtered and exported with a few clicks.
Get started in your city
SharedStreets is working a number of cities to test mobility-metrics for secure mobility data aggregation. The code is open source and free to use. If you are interested in trying it out in your city, let us know, and we are happy to help get you started. E-mail us!


Get Involved
Do you work for a city or government agency? A private company? Or are you an independent researcher or developer? Learn how to start using the SharedStreets Toolkit.
Get Started